CBOE VIX
CBOE VIX
VIX is a volatility index which measures the volatility in the Dow Jones and is also a tradable contract in the US. It has a –ve correlation with the DOW Jones which means if the DOW falls the VIX will tend to shoot up. Analysis of the VIX helps us to analyze to a certain extent the probable direction of US indices in the coming days.
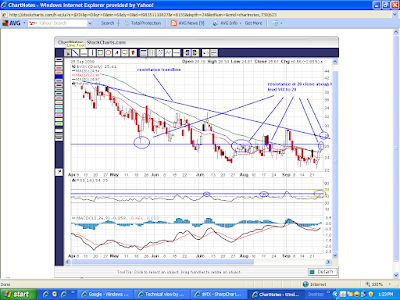
As seen in the chart VIX has resistance at 26 odd levels as shown by the horizontal line, there is also the trend line resistance at 28.
In the last three days VIX HAS shown bullish candles and has stopped exactly at the resistance of 26, a close above 26 will take it to 28 and a close above 28 will most probably see it testing the level of 34.
Also it has shown +ve divergence in MACD.
If the VIX moves up to the levels of 34 he ongoing rally in the DOW will be in danger and the index wil most probably see a correction, however if the VIX is resisted at 28 odd levels it will indicate that the rally in DOW still has some steam left in it and can continue in the short term.
No comments:
Post a Comment